![]() Figure 3 of
LoGiudice, Mol Vis 2006;
12:184-189.
Figure 3 of
LoGiudice, Mol Vis 2006;
12:184-189.
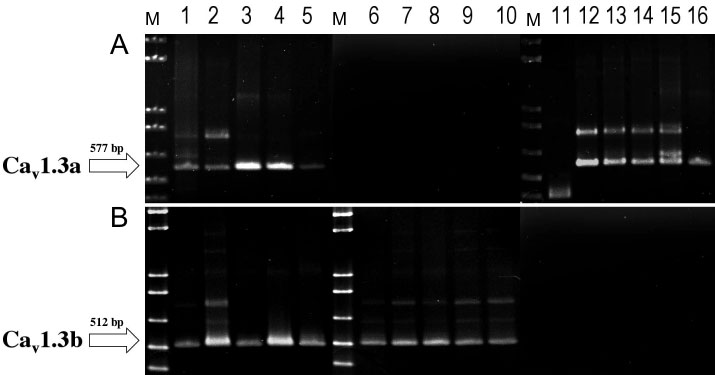
Figure 3. Bipolar cells express transcripts of Ca2+ channel subunits Cav1.3a, Cav1.3b, or both
Gel electrophoresis of reverse transcriptase polymerase chain reaction (RT-PCR) products. cDNA from 16 of 18 positive cells are shown. A: Cav1.3a PCR products. Samples in lanes 1-5 and 11-16 were run on the same gel. Samples in lanes 6-10 were run on a separate gel. B: Cav1.3b products. Sample in lanes 1-10 were run on the same gel. Samples in lanes 11-16 were run on a separate gel. Bands that appear in the same lane in both panels A and B indicate cells that express both subunits. Correct band size is indicated with an arrow. Sample number 11 is smaller in size than the rest of the Cav1.3a products, but sequencing verified that this product is Cav1.3a. It is not known whether this represents a Cav1.3a splice variant. M denotes the 1 kb plus DNA ladder (Invitrogen).