![]() Figure 2 of
LoGiudice, Mol Vis 2006;
12:184-189.
Figure 2 of
LoGiudice, Mol Vis 2006;
12:184-189.
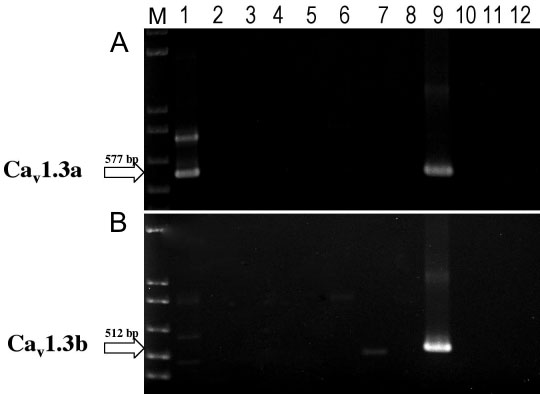
Figure 2. Calcium channel expression pattern in a single experiment
Gel electrophoresis of second round reverse transcriptase polymerase chain reaction (RT-PCR) products. Six negative controls were included to eliminate the possibility of false positives (lanes 2, 3, 5, 8, 11, 12). Six bipolar cells were collected for subunit detection by RT-PCR (lanes 1, 4, 6, 7, 9, 10). Expected band sizes (indicated by arrows): A: Cav1.3a-577 bp. B: Cav1.3b-512 bp. One cell expressed only Cav1.3a (lane 1), one expressed only Cav1.3b (lane 7), and one expressed both subunits (lane 9). On average across experiments, about 25% of all collected bipolar cells expressed one or more calcium channel subunits. M denotes the 1 kb plus DNA ladder (Invitrogen).