![]() Figure 10 of
Boatright, Mol Vis 2006;
12:1706-1714.
Figure 10 of
Boatright, Mol Vis 2006;
12:1706-1714.
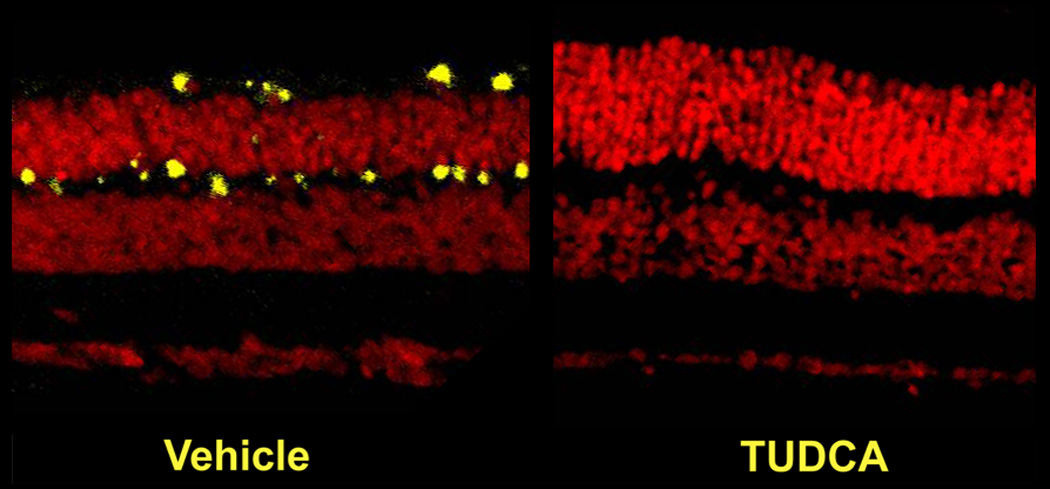
Figure 10. Effect of TUDCA on rd10 mouse retinal morphology and activated caspase-3 immunoreactivity
Confocal micrographs of paraffin-embedded rd10 mouse retina sections assayed for immunoreactivity to activated caspase-3. There was significantly more immunoreactivity (yellow signal) in vehicle-treated sections than in TUDCA-treated sections (1.21±0.42, n=5 versus 0.09±0.19, n=6 mean pixel luminosity per section; p=0.0180).