![]() Figure 1 of
Xiao, Mol Vis 2006;
12:1692-1698.
Figure 1 of
Xiao, Mol Vis 2006;
12:1692-1698.
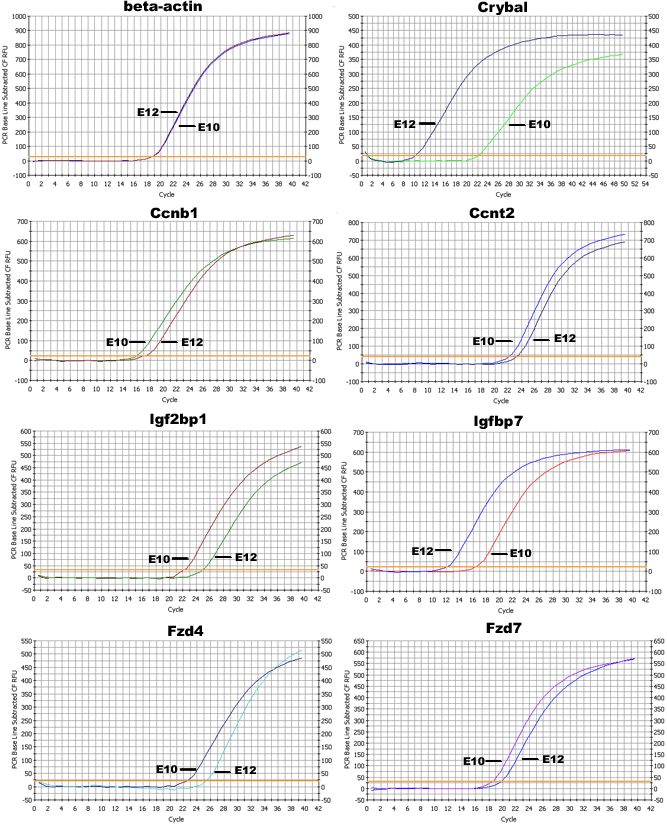
Figure 1. Quantitative real-time PCR (qRT-PCR) to confirm changes of expression of selected genes
The x-axis represents relative fluorescence units (RFU) which reflect the amount of PCR product. The y-axis indicates PCR cycles. E10 and E12 qRT-PCR results are shown in each figure. β-Actin was used as an RNA loading control. βA1-crystallin (Cryba1), a well known gene highly expressed in E12 lens, was used as a positive control. Quantification of the change in expression for each gene (indicated as fold change) is shown in Table 5.
