![]() Figure 5 of
Piri, Mol Vis 2006;
12:1660-1673.
Figure 5 of
Piri, Mol Vis 2006;
12:1660-1673.
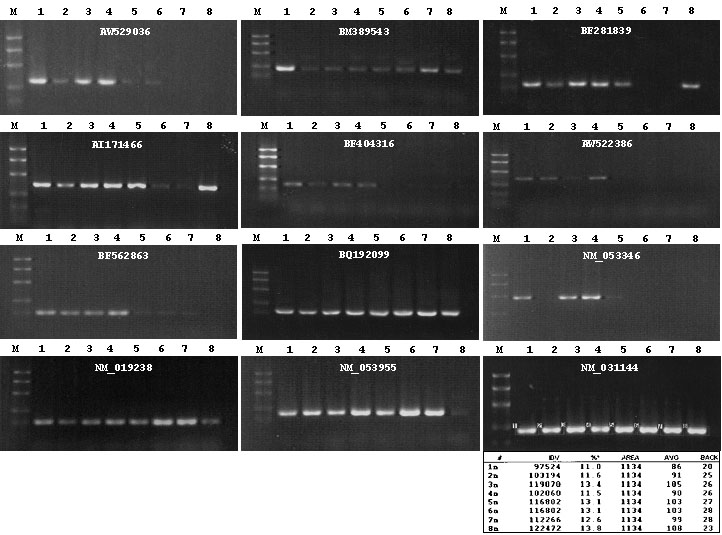
Figure 5. Tissue distribution patterns of several differentially expressed genes
A set of size marker DNAs (100, 200, 300, 500, 750, and 1000 nt) is represented by mDNA, and is shown to the left of the numbered lanes. Lane 1, control retina (control retina is the retina from untreated eyes); Lane 2, RGC-deficient retina; Lane 3, cerebellum; Lane 4, cortex; Lane 5, heart; Lane 6, kidney; Lane 7, liver; Lane 8, muscle. AI171466, AW529036, BQ781402, BF562863, BM389543, AW522386, BF404316, and BF281839 are uncharacterized genes or ESTs. NM_053346 is neuritin (Nrn). NM_053955 is μ-crystallin (Crym). NM_019238 is farnesyl diphosphate farnesyl transferase 1 (Fdft1). NM_031144 is β-actin. The amount of first strand cDNA used in this experiment was normalized based on integrated density values (IDVs) of the PCR product corresponding to β-actin mRNA.