![]() Figure 4 of
Piri, Mol Vis 2006;
12:1660-1673.
Figure 4 of
Piri, Mol Vis 2006;
12:1660-1673.
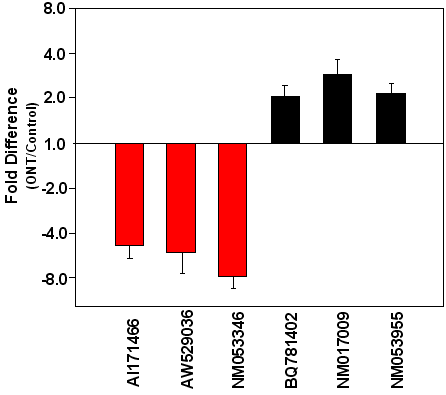
Figure 4. Real-time quantitative PCR analysis of six genes that were differentially regulated after optic nerve transection
Real-time quantitative PCR analysis of several upregulated (shown in the positive scale) and downregulated (shown in the negative scale) genes in optic nerve transection (ONT) rat retinas. AI171466, AW529036, and BQ781402 represent uncharacterized genes. NM_053346 is neuritin (Nrn). NM_053955 is μ-crystallin (Crym); NM_017009 is glial fibrillary acidic protein (Gfap). The results of this experiment correlate with the data obtained by microarrays.
