![]() Figure 1 of
Piri, Mol Vis 2006;
12:1660-1673.
Figure 1 of
Piri, Mol Vis 2006;
12:1660-1673.
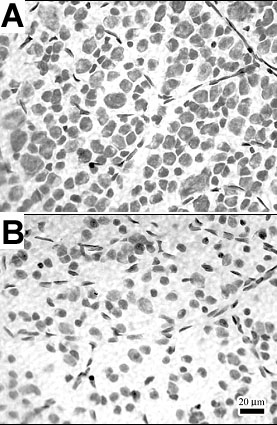
Figure 1. Cell counts in the ganglion cell layer after optic nerve transection
Representative micrographs at midperipheral control (A) and optic nerve transection (ONT; B) retinas. (C) relative number of cells in the ganglion cell layer of the control and optic nerve transection retinas.