![]() Figure 4 of
Duncan, Mol Vis 2006;
12:1632-1639.
Figure 4 of
Duncan, Mol Vis 2006;
12:1632-1639.
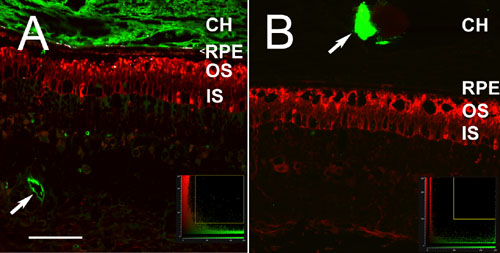
Figure 4. Colocalization analysis of bovine serum albumin, serum retinol-binding protein, and interphotoreceptor retinoid-binding protein in bovine retina
To determine colocalization of fluorophores, we performed scatterplot analysis using composite images which were generated from two independent channel single-wavelength acquisitions. The composite image showing bovine serum albumin (BSA; green channel) and interphotoreceptor retinoid-binding protein (IRBP; red channel) is displayed in A and serum retinol-binding protein (sRBP; green channel) and IRBP (red channel) in B. Scatterplots (panel insets) that correlate the red and green channels, show the pure red and green pixels clustering near the axes of the plot, while colocalized pixels, if present, fall near the center (i.e., x=y) and upper right-hand corner of the scatterplot. To perform the colocalization analysis, we employed an area of interest (AOI), denoted by the white box within the scatterplot, to identify pixels from regions of colocalization. These pixels (shown in white) were mapped to the image. The AOI's for both scatterplots are essentially devoid of any signal arising from colocalized fluorophores with only scant colocalization, consistent with background labeling, visible in A and no areas of colocalization visible in B. Arrows point to the lumen of a retinal blood showing labeled BSA (A) and a choroidal blood vessel showing labeled sRBP (B). The following abbreviations are used: choroid (CH), retinal pigment epithelium (RPE), outer segment (OS), inner segment (IS). (A, B) Scale bar represents 75 μm.