![]() Figure 1 of
Duncan, Mol Vis 2006;
12:1632-1639.
Figure 1 of
Duncan, Mol Vis 2006;
12:1632-1639.
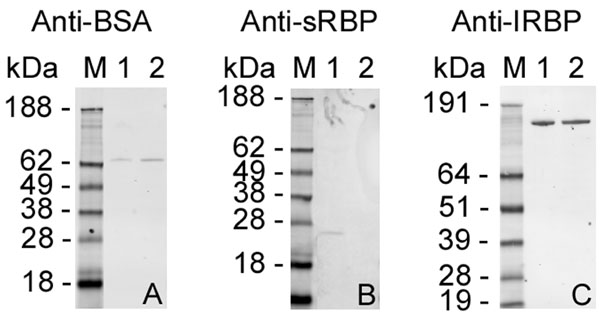
Figure 1. Specificity of the primary antibodies to their respective antigens
Positive controls (1 ng total protein) loaded into lane 1 were purified bovine serum albumin (BSA; A), fetal bovine serum (B), and purified bovine interphotoreceptor retinoid-binding protein (IRBP; C). Bovine neural retina supernatant (1 μg total protein) was loaded into Lane 2 (all panels). The supernatant was prepared by homogenizing bovine neural retinas (n=2) in PBS containing Complete protease inhibitor cocktail (Roche Applied Science) followed by centrifugation at 100,000xg for 1 h at 4 °C. Protein concentration was determined on the supernatant by the Bradford method. Western immunoblot analysis was performed using (A) monoclonal anti-BSA (Clone BSA-33, 1:4000; Sigma-Aldrich), (B) monoclonal antihuman serum retinol-binding protein (Clone 42, 1:1000; BD Biosciences Pharmingen), and (C) rabbit antibovine IRBP (1:5000). The secondary antibodies used were Qdot® 655 conjugated goat F(ab')2 antimouse (1:1000; A, B), and Qdot® 655 conjugated goat F(ab')2 antirabbit (1:1000; C; Quantum Dot Corporation). SeeBlue® (Invitrogen) molecular weight markers are shown in Lane M (all panels). The differences seen in migration of the SeeBlue® molecular weight markers for panels A and B compared to C is due to using either MES- (A, B) or MOPS- (C) SDS running buffer.