![]() Figure 9 of
Srivastava, Mol Vis 2006;
12:1615-1625.
Figure 9 of
Srivastava, Mol Vis 2006;
12:1615-1625.
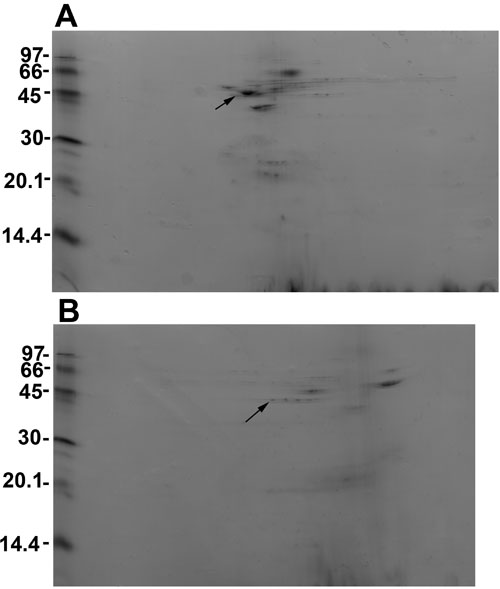
Figure 9.
Two-dimensional gel electrophoretic analysis of proteins isolated from cells of limbal and central corneal regions. A: Protein profiles of cells from the limbal region; B: protein profile from cells of central corneal region. The arrows in A and B mark the 48 kDa protein spots that were identified by MALDI-TOF as α-enolase.