![]() Figure 7 of
Srivastava, Mol Vis 2006;
12:1615-1625.
Figure 7 of
Srivastava, Mol Vis 2006;
12:1615-1625.
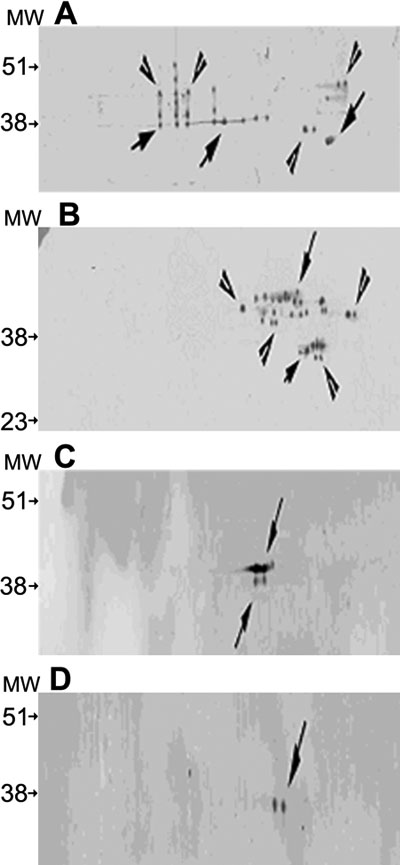
Figure 7.
Western blot analysis of proteins from normal and KC corneas following 2-D gel electrophoretic separation. Western blot analysis of proteins from normal (A) and KC (B) corneas after immunoreactivity with anti-α-enolase antibody. The blots show native α-enolase (48 kDa) and its degradation products. Western blot analysis of proteins from normal (C) and KC (D) corneas following immunoreaction with anti-β-actin antibody. The blots show native β-actin (42 kDa) and its degradation products. Arrows with the stem show the major spots, and arrows without the stem show the minor spots.