![]() Figure 2 of
Srivastava, Mol Vis 2006;
12:1615-1625.
Figure 2 of
Srivastava, Mol Vis 2006;
12:1615-1625.
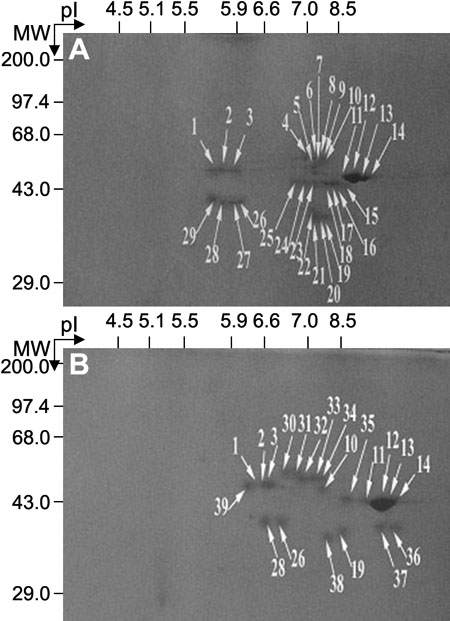
Figure 2.
Comparative proteomic maps of epithelial proteins from (A) normal human and (B) KC corneas. Based on the differences between the 2-D profiles, protein spots were analyzed by MALDI-TOF and ES-MS/MS mass spectrometric methods. The approximate molecular weight (MW) in kDa and the isoelectric point (pI) of the standard proteins used during the 2-D gel electrophoresis are shown.