![]() Figure 3 of
Micera, Mol Vis 2006;
12:1594-1600.
Figure 3 of
Micera, Mol Vis 2006;
12:1594-1600.
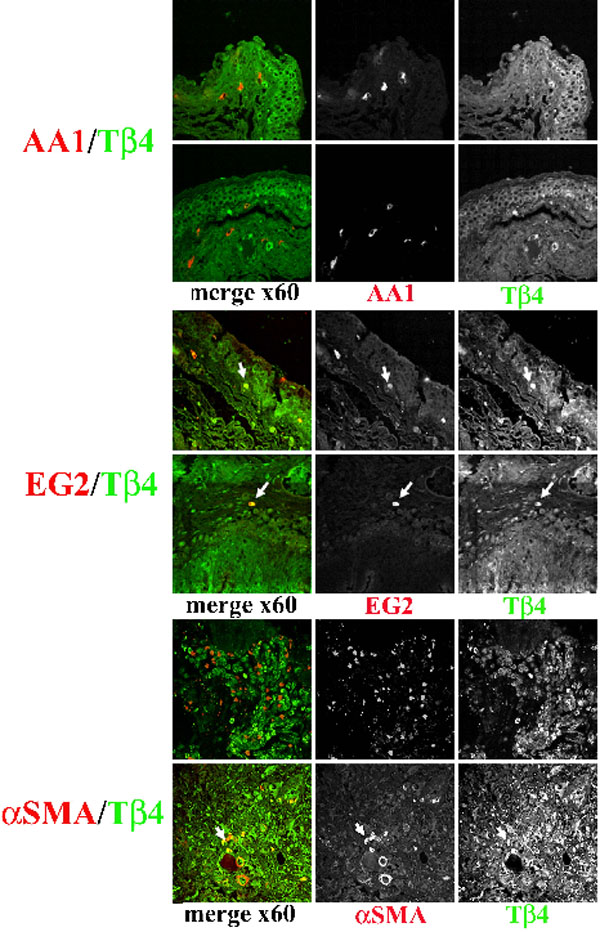
Figure 3. Specific Tβ4 protein distribution in cells populating the VKC conjunctiva
Double-fluorescent labeling for Tβ4 (green/cy2) and specific immune/structural markers (red/cy5) in VKC biopsies counterstained with Toto-3 (blue). Overlay (first column) showing Tβ4 (cy2) immunoreactivity in mast cells (AA1/cy5), eosinophils (EG2/cy5), and myofibroblasts (α-SMA/cy5). Second and third columns show the single staining for each specific overlays. (60X/oil immersion).