![]() Figure 2 of
Namekata, Mol Vis 2006;
12:1586-1593.
Figure 2 of
Namekata, Mol Vis 2006;
12:1586-1593.
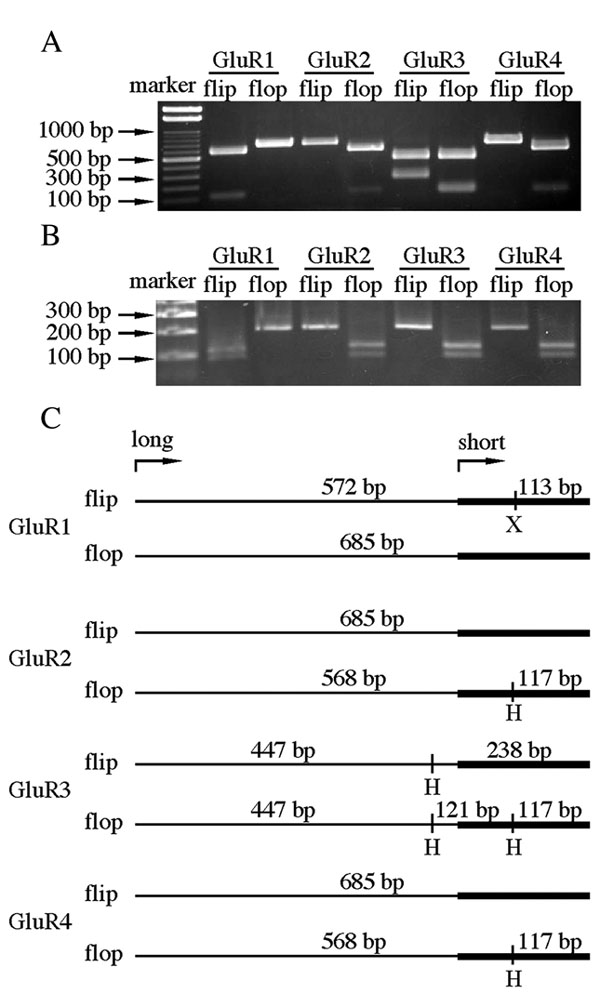
Figure 2. DNA fragments specific for flip and flop sequences
A, B: PCR products using "long" forward primers (Table 1) were 685 bp while those using "short" forward primers were 200 bp. The PCR products amplified using "long" and "short" forward primers were digested with restriction endonucleases and then electrophoresed on a 3% agarose gel (A and B, respectively). The digested fragments were visualized after staining with ethidium bromide. C: Schematic representation of the specific GluR-flip and -flop fragments were amplified using "long" forward primers and "short" forward primers (thick lines). The restriction endonuclease cleavage patterns were used to confirm specific amplification. X represents XspI; H represents HincII.