![]() Figure 1 of
Namekata, Mol Vis 2006;
12:1586-1593.
Figure 1 of
Namekata, Mol Vis 2006;
12:1586-1593.
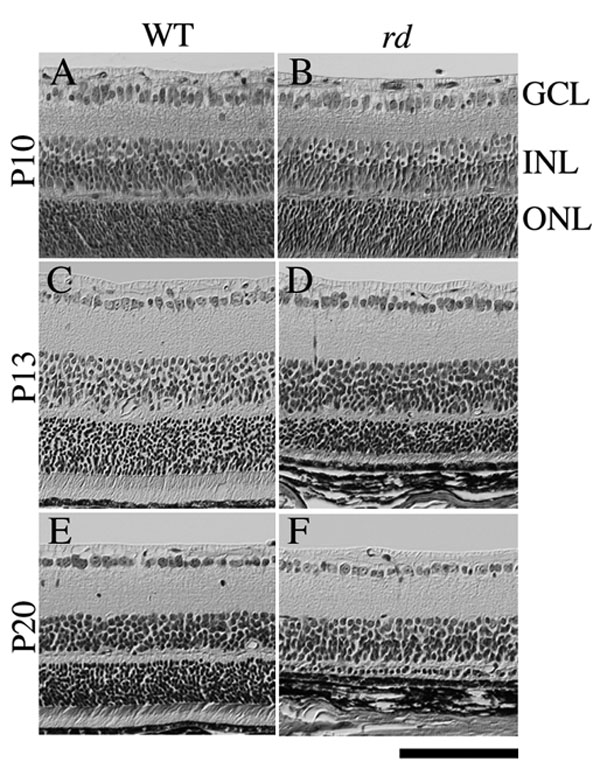
Figure 1. Photoreceptor degeneration in rd mice
Light micrograph of retinal sections from wild-type (WT; A, C, E) and rd (B, D, F) mice at P10 (A, B), P13 (C, D), and P20 (E, F). Note the progressive reduction of the outer nuclear layer thickness in rd mice, resulting in a single row of photoreceptors at P20 (F). GCL represents ganglion cell layer; INL represents inner nuclear layer; ONL represents outer nuclear layer. Scale bar represents 100 μm.