![]() Figure 3 of
Yoshida, Mol Vis 2006;
12:1558-1564.
Figure 3 of
Yoshida, Mol Vis 2006;
12:1558-1564.
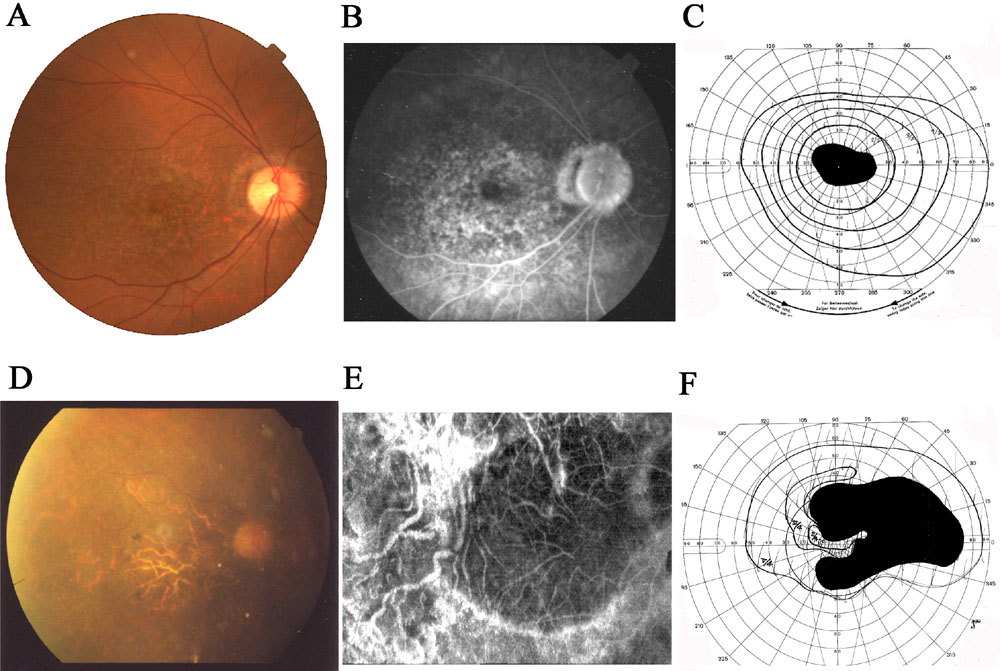
Figure 3. Ophthalmologic and functional analyses
Fundus photographs (A, D), fluorescein fundus angiograms (B, E), and Goldmann kinetic perimetric fields (C, F) of patients with mutations of the GUCY2D gene. (A, B, C) Right eye, proband; (D, E, F) Right eye, the proband's father.