![]() Figure 5 of
Yoshida, Mol Vis 2006;
12:1552-1557.
Figure 5 of
Yoshida, Mol Vis 2006;
12:1552-1557.
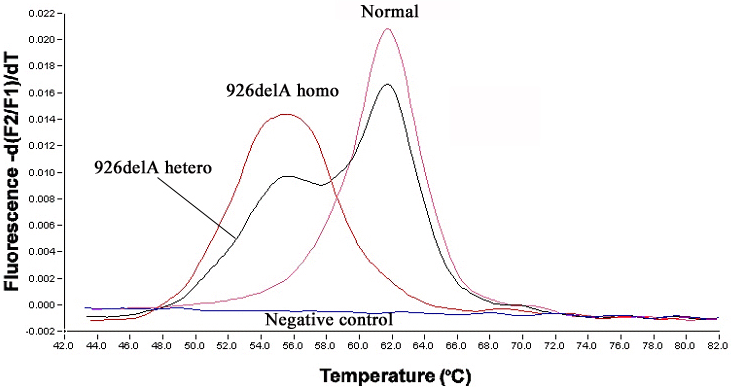
Figure 5. Real-time genotyping of the SAG gene around the nucleotide by hybridization probe melting curve analysis
Analysis was done by plotting the first negative derivative of the fluorescence with respect to temperature [-(dF/dT) versus T]. The melting peak temperatures obtained from the derivative melting curves are as follows: 62.0 °C for homozygous wild-type, 62.0 °C and 54.0 °C for the heterozygous 926delA, and 54.0 °C for homozygous mutated type. Genotypes are indicated on top of each peak.
