![]() Figure 2 of
Li, Mol Vis 2006;
12:1506-1510.
Figure 2 of
Li, Mol Vis 2006;
12:1506-1510.
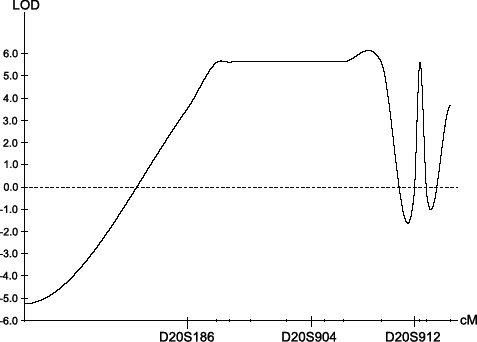
Figure 2. Multipoint linkage analysis
Multipoint LOD scores. The markers and intervals: D20S186-2.11 cM- D20S163-0.93 cM- D20S915-1.59 cM- D20S152-2.36 cM- D20S904-1.89 cM- D20S875-0.89 cM- D20S112-1.41 cM- D20S1140-2.78 cM-D20S432-0.41 cM- D20S912-0.43 cM- D20S54-0.52 cM-D20S477-1.74 cM- D20S101. Multipoint LOD scores with the support interval narrow the ADPCZNC locus to a 16.37 cM region between markers D20S186 and D20S912.
