![]() Figure 2 of
Stambolian, Mol Vis 2006;
12:1499-1505.
Figure 2 of
Stambolian, Mol Vis 2006;
12:1499-1505.
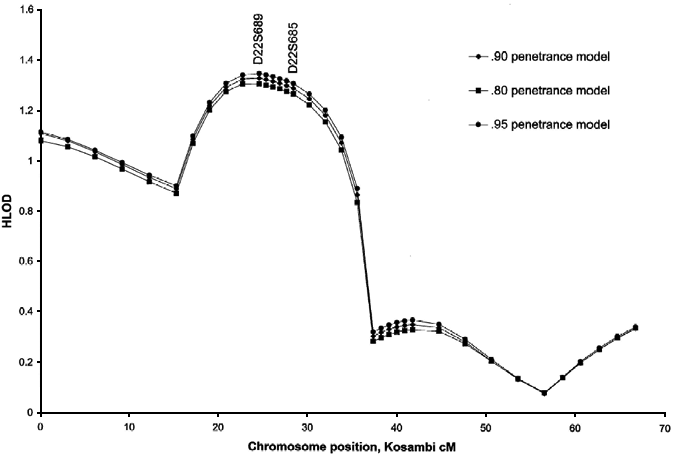
Figure 2.
Multipoint HLODs in the chromosome 22 linkage region upon variation of the values assumed for genotypic penetrances in the genetic model used in the parametric linkage analyses. Penetrance models used were as follows: 90% (line with diamond marker); 80% (line with square marker); 95% (line with circle marker). The phenocopy rate used for all three analyses was fixed at 10%.
