![]() Figure 1 of
Stambolian, Mol Vis 2006;
12:1499-1505.
Figure 1 of
Stambolian, Mol Vis 2006;
12:1499-1505.
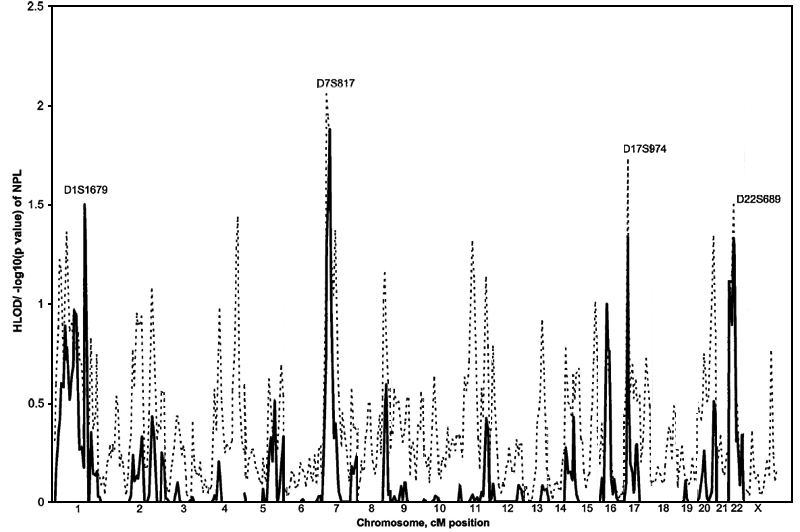
Figure 1.
Genome-wide linkage analysis for 19 Jewish families assuming that penetrance of the dominant risk allele is 0.9 and the phenocopy rate is 0.10. Multipoint HLOD (black line) and -log10 (p-value) of the NPL (dotted line) were calculated with GENEHUNTER, version 2.1. Only loci with heterogeneity LOD score greater than 1.0 are identified.
