![]() Figure 2 of
Ayala-Ramirez, Mol Vis 2006;
12:1483-1489.
Figure 2 of
Ayala-Ramirez, Mol Vis 2006;
12:1483-1489.
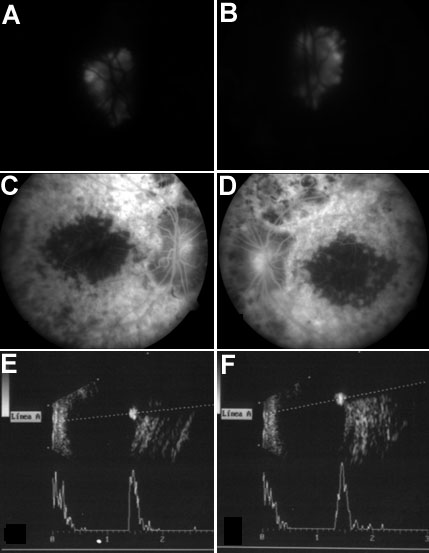
Figure 2. Fluorescein angiography and ultrasound studies in patient number 1
Autofluorescence phenomenon due to optic disc drusen (A, B), fluorescein angiography arteriovenous phase revealed choroidal transmission hyperfluorescence corresponding to retinal pigment epithelium atrophy as well as blockage hypofluorescence localized to areas of pigment clumping (C, D). B-mode ultrasound showed decreased axial length and optic disc drusen (E, F). Left column represents right eye (OD); right column represents left eye (OS).