![]() Figure 4 of
Maier, Mol Vis 2006;
12:1477-1482.
Figure 4 of
Maier, Mol Vis 2006;
12:1477-1482.
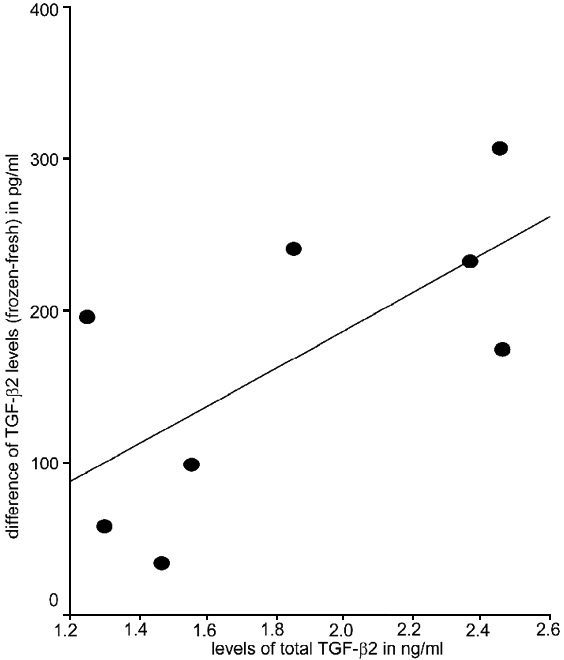
Figure 4.
Scatter plot showing the difference in active TGF-β2 levels in aqueous humor before and after cryopreservation in relation to the total TGF-β2 level in the same samples (n=8 from group III). There is a markedly, but statistically insignificant correlation between the difference in active TGF-β2 levels and total TGF-β2 (r=-0.68, p=0.06, Pearson correlation).
