![]() Figure 2 of
Maier, Mol Vis 2006;
12:1477-1482.
Figure 2 of
Maier, Mol Vis 2006;
12:1477-1482.
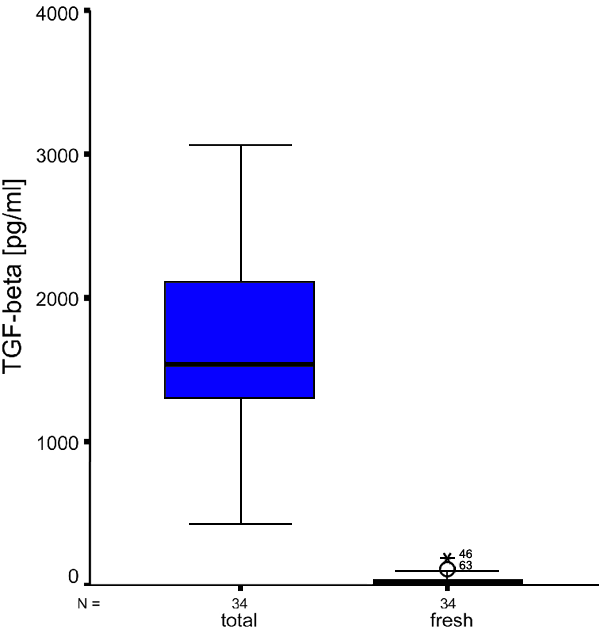
Figure 2. Levels of active TGF-β2 in aqueous humor in group III
Levels of active TGF-β2 in aqueous humor determined directly after sampling (median 28 pg/ml) and levels of total TGF-β2 after acidic activation (median 1,542 pg/ml) for group III (n=34). Box plot diagrams given as median values, 25/75% percentiles (boxes), 10/90% percentiles (bars), outliers (circles) and extremes (asterisk) of TGF-β2 levels.
