![]() Figure 2 of
Bourges, Mol Vis 2006;
12:1461-1466.
Figure 2 of
Bourges, Mol Vis 2006;
12:1461-1466.
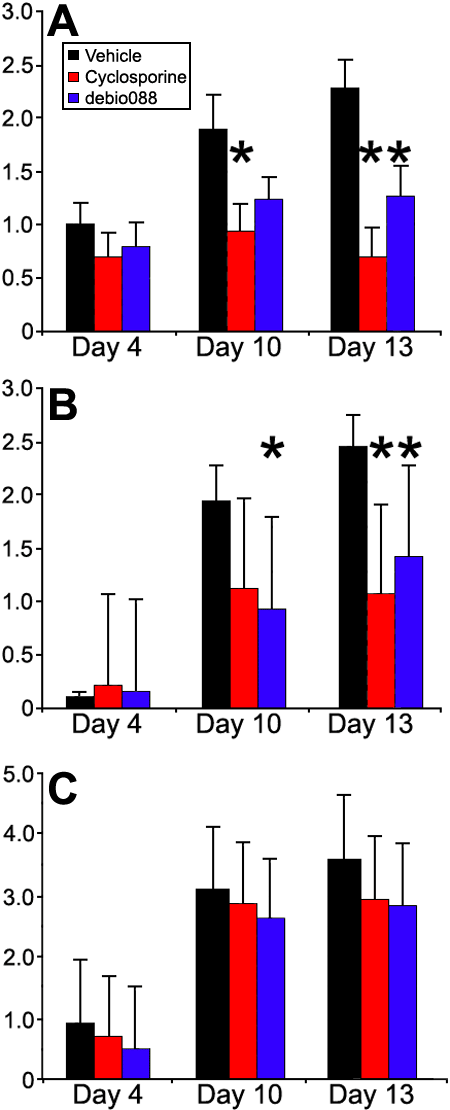
Figure 2.
Mean clinical scores (±SEM) as a function of time. A: Edema scores, B: Opacification scores, C: Neovessels scores. The asterisk represents a significant difference compared to the vehicle group with a p<0.05.
