![]() Figure 2 of
Burgess, Mol Vis 2006;
12:1437-1447.
Figure 2 of
Burgess, Mol Vis 2006;
12:1437-1447.
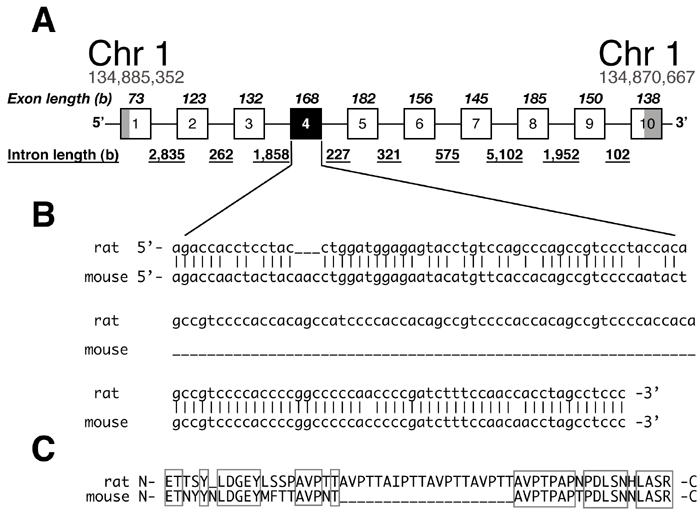
Figure 2. Diagram of rat MFG-E8 gene
A: Diagram of rat MFG-E8 gene showing the size of the 10 exons (italicized numbers) and 9 introns (underlined numbers) on rat chromosome 1. Gray bars in exons 1 and 10 represent the 5' and 3' untranslated regions. B: Complete nucleotide sequences of rat and mouse exon 4, which code for the P/T rich insert. Rat exon 4 is 56 nucleotides longer than mouse exon 4. Sequences are aligned to show differences and similarities of rat and mouse exon 4. C: Deduced amino acid sequences of rat and mouse inserts coded by exon 4. The gray boxes show amino acid sequence identities in rat and mouse exon 4.
