![]() Figure 1 of
Burgess, Mol Vis 2006;
12:1437-1447.
Figure 1 of
Burgess, Mol Vis 2006;
12:1437-1447.
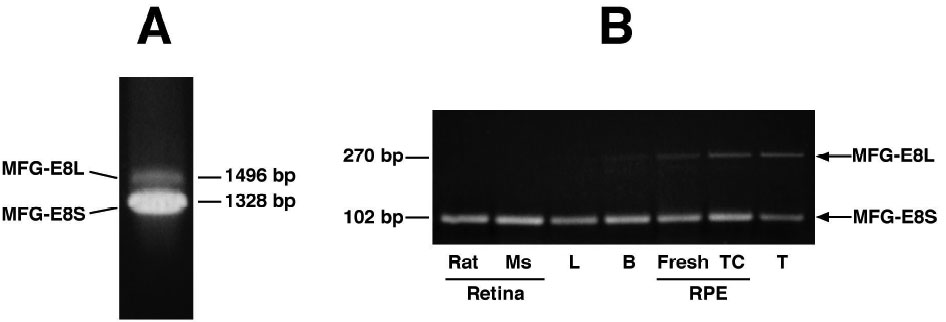
Figure 1. Rat tissues produce both MFG-E8L and MFG-E8S
A: PCR of rat testis cDNA using MFG-E8-specific primers (1 and 2) produces two bands of 1328 bp and 1496 bp. B: PCR of rat tissue cDNA using nested primers (3 and 4) designed to span the region of the long form insert, produces two bands of 270 bp and 102 bp. Ms represents mouse; L represents liver; B represents brain; TC represents tissue culture; T represents testis.