![]() Figure 2 of
Dvoriantchikova, Mol Vis 2006;
12:1417-1426.
Figure 2 of
Dvoriantchikova, Mol Vis 2006;
12:1417-1426.
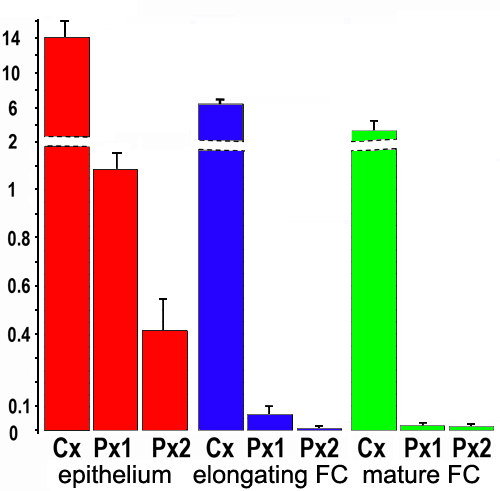
Figure 2.
Relative enrichment of Panx1, Panx2, and Cx50 transcripts detected by quantitative real-time RT-PCR in microdissected lens regions (normalized to the levels of Actb transcript). Bars indicate SD values.
