![]() Figure 5 of
Bernstein, Mol Vis 2006;
12:147-155.
Figure 5 of
Bernstein, Mol Vis 2006;
12:147-155.
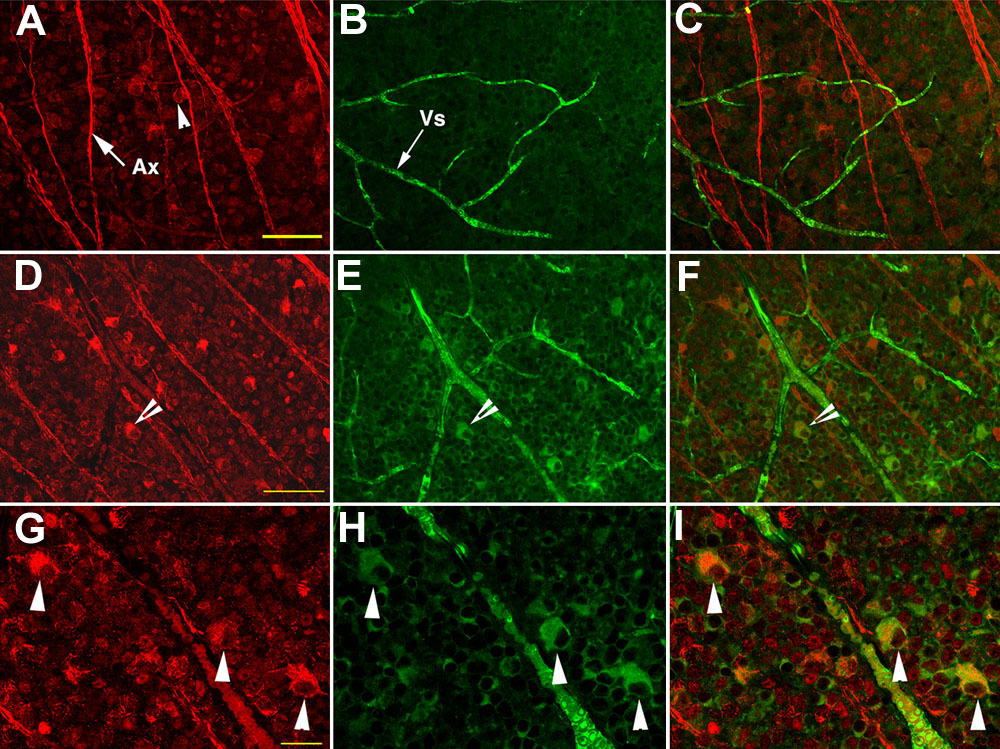
Figure 5. Expression of Bex-ir and β-galactosidase in postaxonal stroke transgenic mice
Control sections (untreated eye) are shown in A-C: Low power images of rAION-affected regions are shown in D-F: High power images of the same area are shown in G-I. A,D,G: Bex-ir expression. Axons are indicated with an arrow, while Bex-ir positive cell bodies are indicated with arrowheads. B,E,H: β-galactosidase expression. Retinal vasculature (Vs; B) is lacZ positive, due to endogenous lacZ expression by RBCs, and indicated with an arrow. lacZ expression in ganglion cells is indicated by arrowheads. C,F,I: merged confocal images (Bex+lacZ expression). lacZ expression is absent in retinal neurons in control eyes (B). lacZ expression is apparent in retinal cells three days post-rAION (E,F, arrowheads). Bex-ir signal is also present in the same cells expressing lacZ (D, arrowhead) and in the merged image (F). At high magnification, Bex-ir signal is increased in a number of cells (G, arrowheads), revealing that ischemia-affected, lacZ-expressing RGCs (H,I, arrowheads) have a relative transport block resulting in cytoplasmic Bex-ir accumulation at the cell soma. The scale bars represent 50 μm in A,D and 20 μm in G.