![]() Figure 3 of
Bernstein, Mol Vis 2006;
12:147-155.
Figure 3 of
Bernstein, Mol Vis 2006;
12:147-155.
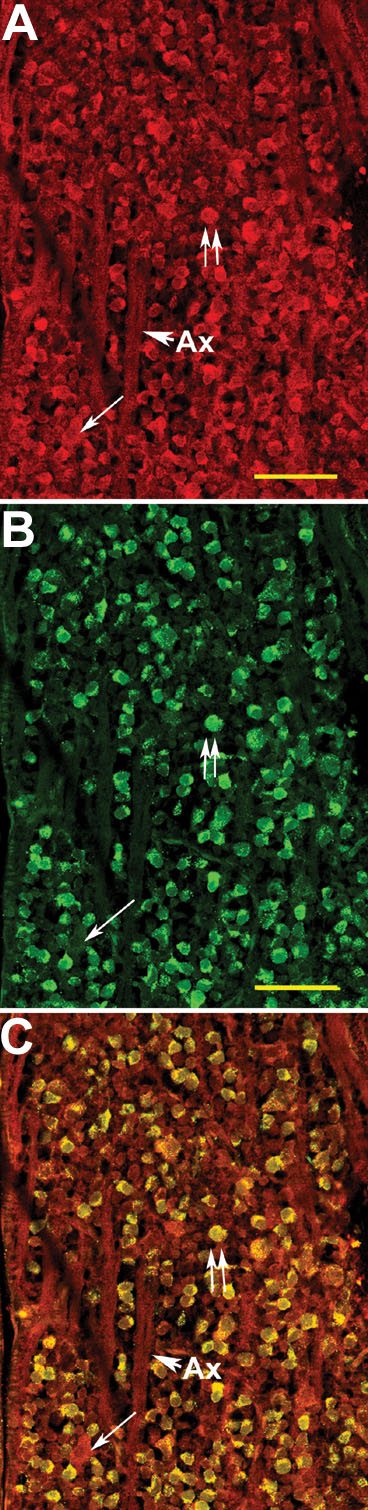
Figure 3. Bex-ir expression co-localization with fluorogold-labeled retinal ganglion cells in rat
Two weeks after superior colliculus injection with flurogold, retinas were reacted with primary antibodies to Bex1 (A) and fluorogold (B). C: Merged confocal image. Retrograde transported fluorogold signal is seen in RGCs (B, double arrows), while Bex expression is seen in RGC axons (Ax; A), and in RGC cell bodies (A, double arrows). Some Bex positive cells in the layer which do not react with antifluorogold antibody are also present (A-C, single arrows). The scale bars represent 100 μm.