![]() Figure 2 of
Bernstein, Mol Vis 2006;
12:147-155.
Figure 2 of
Bernstein, Mol Vis 2006;
12:147-155.
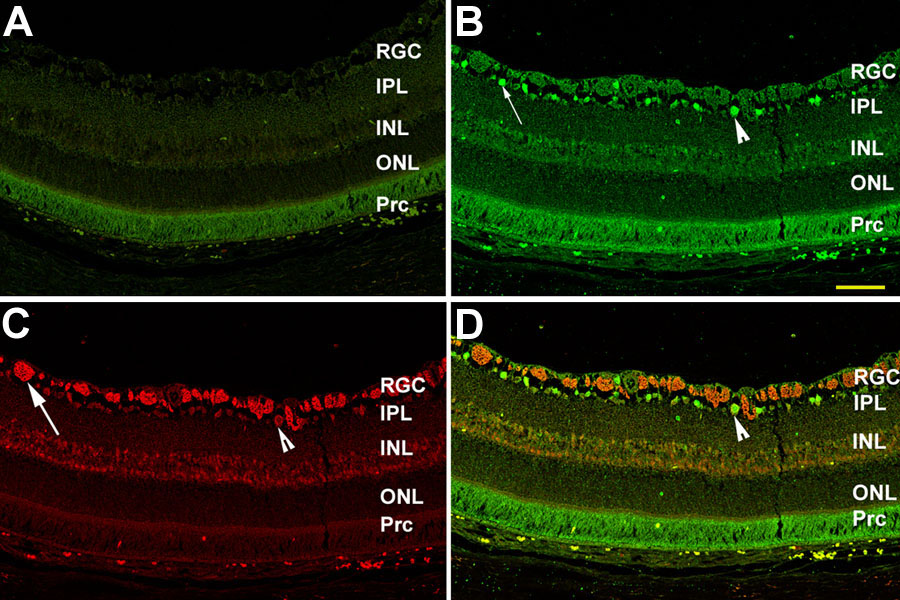
Figure 2. Confocal analysis of Bex and Brn3b expression in rat retina
A: Negative control (no primary; Cy3 and Cy5 labeled secondary antibodies only). Photoreceptor autofluorescence is seen. B: Primary antibody to Brn3b. Brn3b preferentially intensely labels small retinal ganglion cells (RGCs, arrow and arrowhead), while large RGCs are not as intensely labeled. A few RGCs with strong Brn3b signal co-label with Bex1 antibody (B-D, arrowhead). C: Retinal Bex-ir signal. Bex signal is strongest in large RGCs (arrow), while weaker expression is also found in small RGCs (arrowhead). D: Confocal localization of Brn3b and Bex-ir. Both proteins are expressed in RGCs. The scale bar represents 50 μm. The inner plexiform layer (IPL), inner nuclear layer (INL), outer nuclear layer (ONL), and photorecptor layer (Prc) are identified.