![]() Figure 5 of
Lyu, Mol Vis 2006;
12:1403-1410.
Figure 5 of
Lyu, Mol Vis 2006;
12:1403-1410.
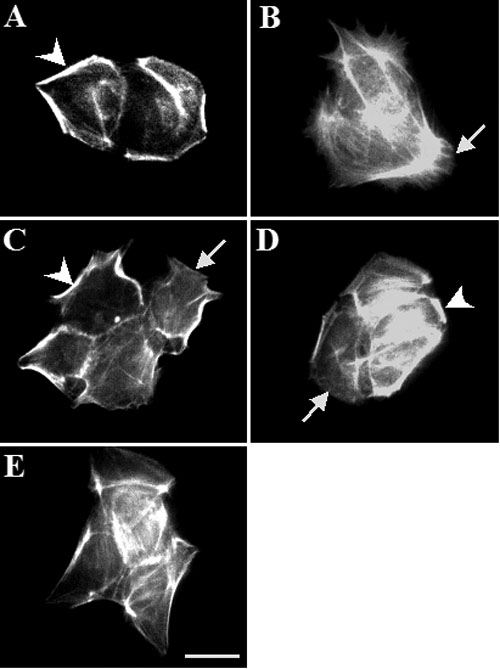
Figure 5.
Cytoskeletal rearrangement in insulin-stimulated THCE cells. THCE cells (2x10³) were plated on slide chambers coated with diluted Matrigel matrix and starved of serum and growth factors for 24 h. Cells pretreated with DMSO (A, B) 100 nM wortmannin (C), 1 μM AG1478 (D), or 50 μM GM6001 (E) for 1 h were incubated with vehicle (A) or 5 μg/ml insulin (B-E). After 1 h, cells were fixed and stained with rhodamine-phalloidin. The photograph in B shows numerous stress fibers and little submembranous cortical actin (arrowhead). Scale bar, 10 μm.