![]() Figure 4 of
Liang, Mol Vis 2006;
12:1392-1402.
Figure 4 of
Liang, Mol Vis 2006;
12:1392-1402.
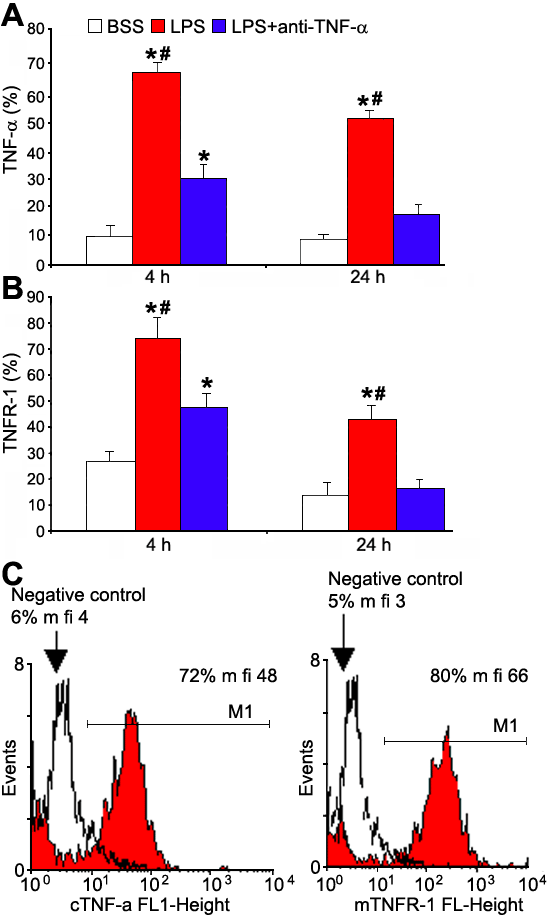
Figure 4.
TNF-α and TNFR-1 expression evaluated by flow cytometry in rabbit conjunctival IC specimens. A,B: Flow cytometry analysis of IC specimens. Percentages (mean±SD) of positive cells in rabbit eyes injected with BSS, LPS, or LPS+anti-TNF-α at 4 h and 24 h. The asterisk indicates a p<0.001 compared to BSS-injected conjunctivas and the sharp (hash mark) dentoes a p<0.001 compared to LPS+anti-TNF-α-injected conjunctivas. C: Flow cytometric fluorescence histograms of TNF-α and TNFR-1 expression overlaid with isotypic negative controls in IC specimens from rabbits injected with LPS at 4 h.
