![]() Figure 5 of
Singh, Mol Vis 2006;
12:1372-1379.
Figure 5 of
Singh, Mol Vis 2006;
12:1372-1379.
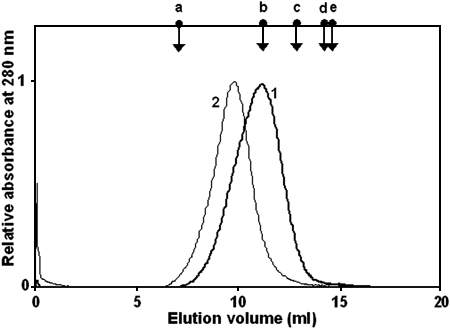
Figure 5.
Gel-filtration chromatography of wild type and G98R αA-crystallin on a Superpose 6 HR10/30 FPLC column. Elution profiles of the wild type (curve 1) and the mutant (curve 2) αA-crystallin show that the mutant forms relatively larger oligomeric assembly. The elution positions of molecular mass standards are indicated by down arrows. a, blue dextran (2000 kDa); b, thyroglobulin (669 kDa); c, ferritin (440 kDa); d, catalase (232 kDa); e, aldolase (158 kDa).
