![]() Figure 2 of
Singh, Mol Vis 2006;
12:1372-1379.
Figure 2 of
Singh, Mol Vis 2006;
12:1372-1379.
Figure 2.
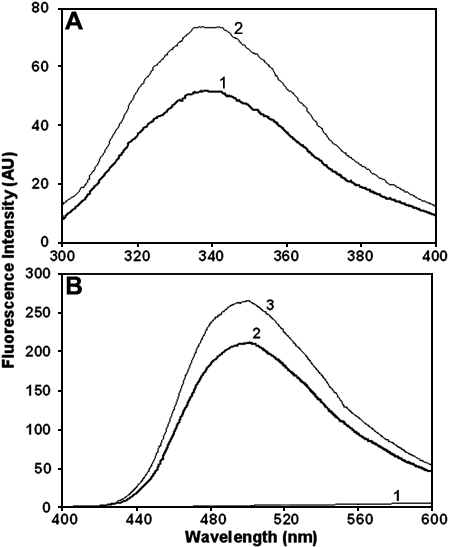
Intrinsic tryptophan fluorescence and bis-ANS binding of the wild type and G98R αA-crystallin. A: Intrinsic tryptophan fluorescence spectra of the wild type (curve 1) and the mutant (curve 2) αA-crystallin indicating that the mutant protein exhibits enhanced fluorescence intensity. A sample of 0.2 mg/ml the wild type or the mutant αA-crystallin in TNE buffer was used. The samples were excited at 295 nm. The excitation and emission band passes were set at 2.5 nm. B: Fluorescence spectra of bis-ANS (10 mM) in buffer alone (curve 1) and in the presence of 0.2 mg/ml wild type (curve 2) or G98R αA-crystallin (curve 3) indicating that the mutant protein exhibits relatively more bis-ANS binding. Excitation wavelength was set at 390 nm. The excitation and emission band passes were set at 2.5 nm.
