![]() Figure 1 of
Singh, Mol Vis 2006;
12:1372-1379.
Figure 1 of
Singh, Mol Vis 2006;
12:1372-1379.
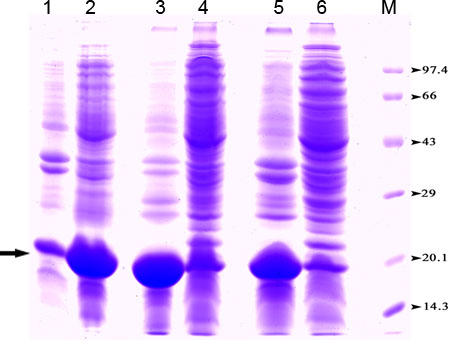
Figure 1.
SDS-PAGE of soluble and insoluble fractions of E.coli BL21 (DE3) cells over expressing wild type and mutant αA crystallin at 37 °C and 30 °C. Lanes 1 and 2 represent the insoluble and soluble fractions, respectively of cells grown at 37 °C expressing the wild type αA crystallin indicating that most of the protein is present in the soluble fraction. Lanes 3 and 4 represent the insoluble and soluble fractions, respectively of cells grown at 37 °C expressing the mutant G98RαA crystallin, indicating that most of the mutant protein is present in the insoluble fraction. Lanes 5 and 6 represent the insoluble and soluble fractions, respectively of cells grown at 30 °C expressing the mutant G98R αA crystallin indicating that even at low temperature, the mutant protein goes in to the insoluble fraction. Lane M shows the positions of molecular mass markers. Arrow indicates the position of the wild type or the mutant αA crystallin.