![]() Figure 4 of
Sun, Mol Vis 2006;
12:1364-1371.
Figure 4 of
Sun, Mol Vis 2006;
12:1364-1371.
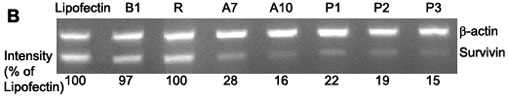
Figure 4.
Function analysis of selected ASOs against survivin in vitro. A: Effect of ASOs on the growth of HepG2 cells, analyzed by MTS reagent. Cells were treated with oligonucleotides (A1-12, B1-3, and R, respectively) in the presence of lipofectin. Cell growth was determined in triplicate plates 72 h after the start of transfection using the MTS reagent. Each value represents the mean±SD of four independent experiments. B: Effects of ASOs on the level of survivin mRNA in HepG2 cells. Cells were transfected with 0.4 μM ASOs (P1, P2, P3, A7, and A10), or control oligonucleotides B1 and R for 24 h. Survivin mRNA was analyzed by RT-PCR and coamplified with β-actin mRNA. The number under each band is expressed as a percentage of lipofectin control, normalized by the corresponding β-actin level.