![]() Figure 3 of
Sun, Mol Vis 2006;
12:1364-1371.
Figure 3 of
Sun, Mol Vis 2006;
12:1364-1371.
Figure 3.
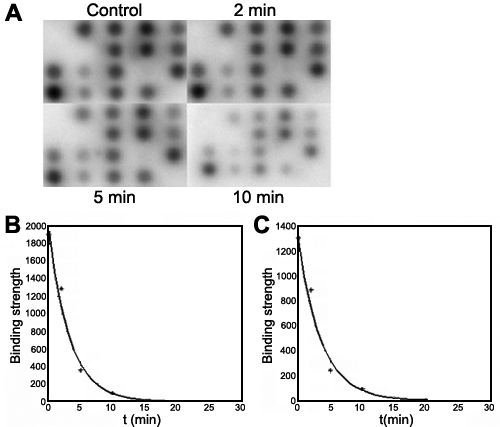
Cleavage of heteroduplex mediated by RNase H on microarrays in situ. A: A time course of 0.125 U RNase H reaction within 20 μl buffer. Heteroduplexes were incubated with RNase H for different times (2, 5, and 10 min) or without RNase H (control). B and C: Kinetic features of the cleavage reaction by RNase H. B and C were the best-fit curve for signal strength of oligonucleotides P3 and A10, respectively.