![]() Figure 4 of
Hammer, Mol Vis 2006;
12:1348-1354.
Figure 4 of
Hammer, Mol Vis 2006;
12:1348-1354.
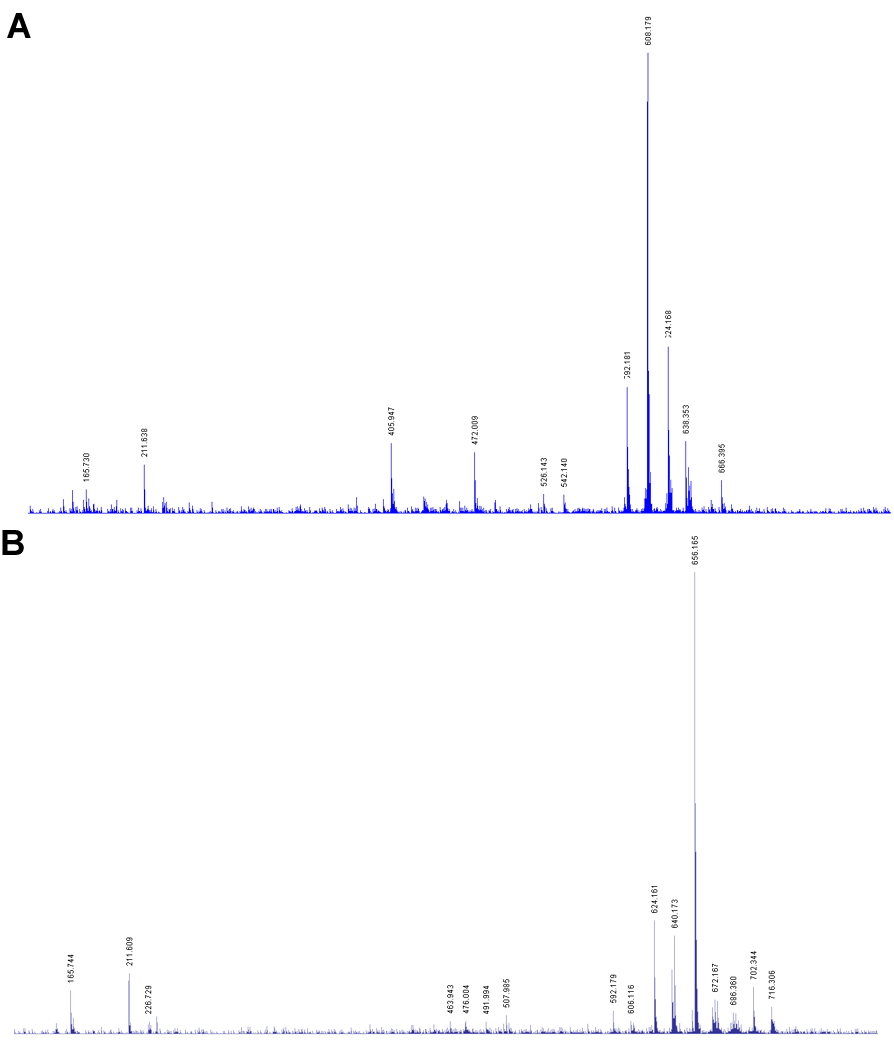
Figure 4. Mass spectra of photo-derivatives of A2-E
MALDI-TOF spectra (Ultraflex II TOF/TOFA) of A2-E photo-derivatives: A2-E irradiated with 0.2 mW/mm2, dominated by the monooxo-A2-E (m/z=608). B: A2-E irradiated with 8.9 mW/mm2, dominated by the tetraoxidized product (m/z=656). Peaks with differences of 16 m/z-units indicate gradual oxidation.
