![]() Figure 5 of
Tserentsoodol, Mol Vis 2006;
12:1306-1318.
Figure 5 of
Tserentsoodol, Mol Vis 2006;
12:1306-1318.
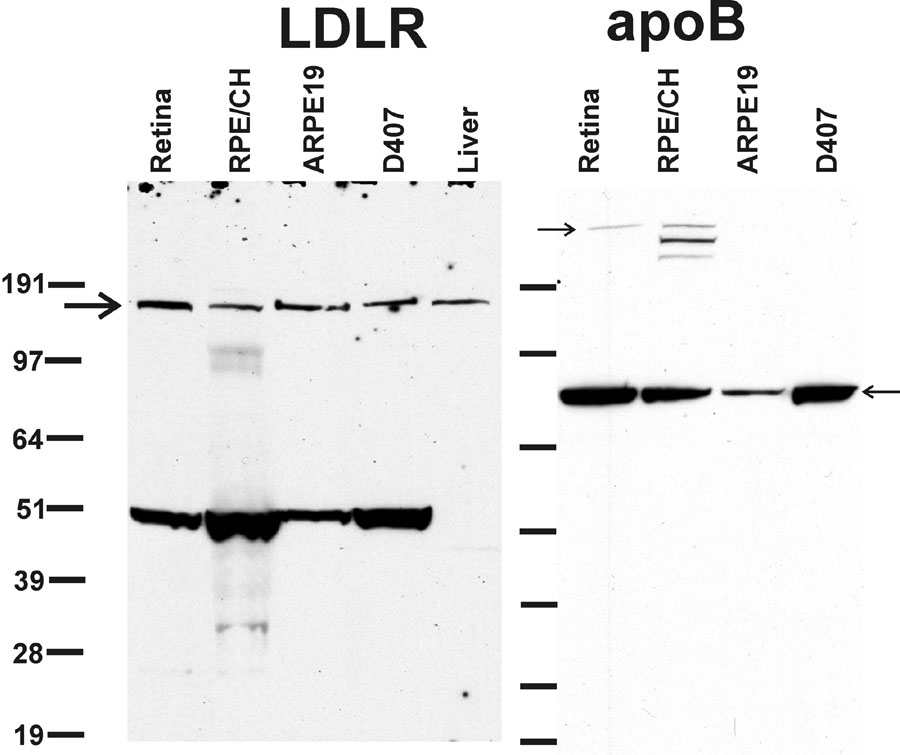
Figure 5. Immunoblots demonstrating LDLR and apoB expression
Expression of LDLR and apoB were determined by SDS-PAGE and the immunoblots for both antibodies were developed under identical conditions. SDS-PAGE and blots for both samples were run under identical conditions (see Materials and Methods). The right-pointing arrows mark expected molecular size for low density lipoprotein receptor (ca. 120 and 160 kDa) and apoB (ca. 540 kDa). The left-pointing arrow mark the apoB 70 kDa degradation product.