![]() Figure 4 of
Tserentsoodol, Mol Vis 2006;
12:1306-1318.
Figure 4 of
Tserentsoodol, Mol Vis 2006;
12:1306-1318.
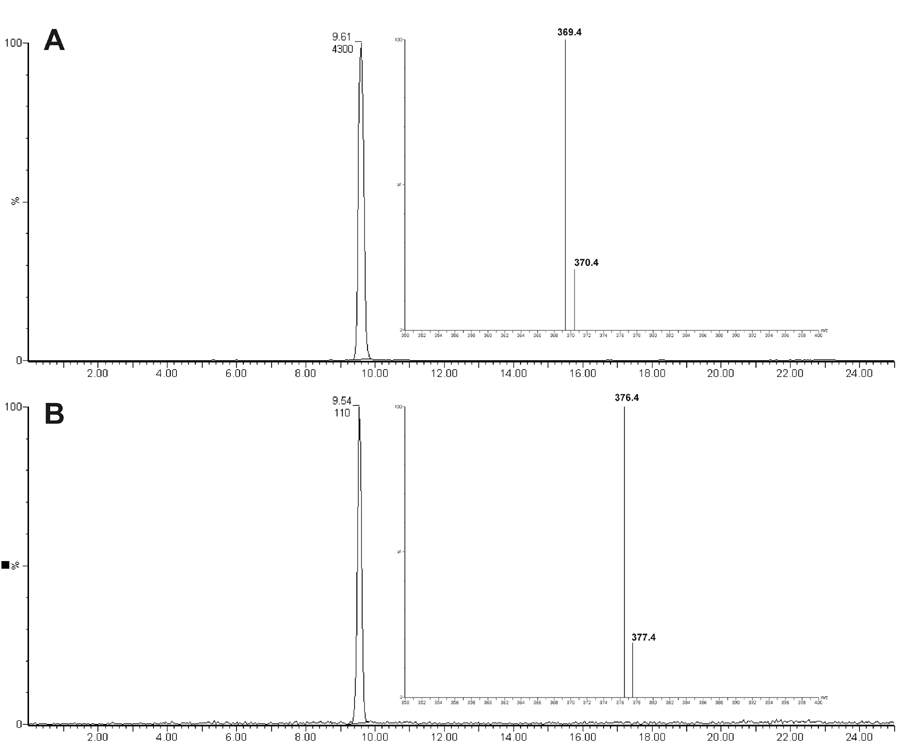
Figure 4. HPLC-MS analysis of saponified rat retina extracts 4 h after injection with deuterated cholesterol-low density lipoprotein
The chromatogram demonstrates the total ion current (TIC) for (A) the m/z 369 (cholesterol) and (B) the m/z 376 deuterated cholesterol (D7Ch). Insets show the spectrum of each ion. Quantification was performed by TIC peak area integration. In this particular example, analysis shows a 39:1 M ratio of cholesterol (Ch) to D7Ch. The average values obtained from three separate analyses at different concentrations are shown in Table 1.
