![]() Figure 5 of
Wu, Mol Vis 2006;
12:1292-1302.
Figure 5 of
Wu, Mol Vis 2006;
12:1292-1302.
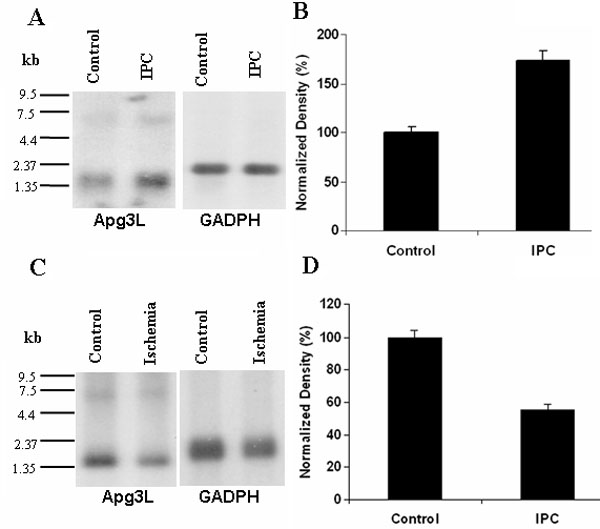
Figure 5. Expression levels of Apg3p
Expression levels of Apg3 are shown after retinal ischemic preconditioning (A and B) and after prolonged retinal ischemia (C and D). A representative northern blot result from the experiments is shown in (A and C). A: The same amount of RNA from ischemic preconditioning-treated and sham control retinas was probed with the Apg3 cDNA, stripped, then probed with the GAPDH cDNA. B: The Apg3 RNA levels were semi-quantified by densitometry and normalized by GAPDH mRNA levels. C: RNA from the prolonged ischemic and sham control retinas was first probed with the Apg3 cDNA and then probed with the GAPDH cDNA. D: Densitometry results were normalized with GAPDH mRNA levels. The values are expressed as the mean±SEM, (n=3).