![]() Figure 2 of
Rozsa, Mol Vis 2006;
12:125-141.
Figure 2 of
Rozsa, Mol Vis 2006;
12:125-141.
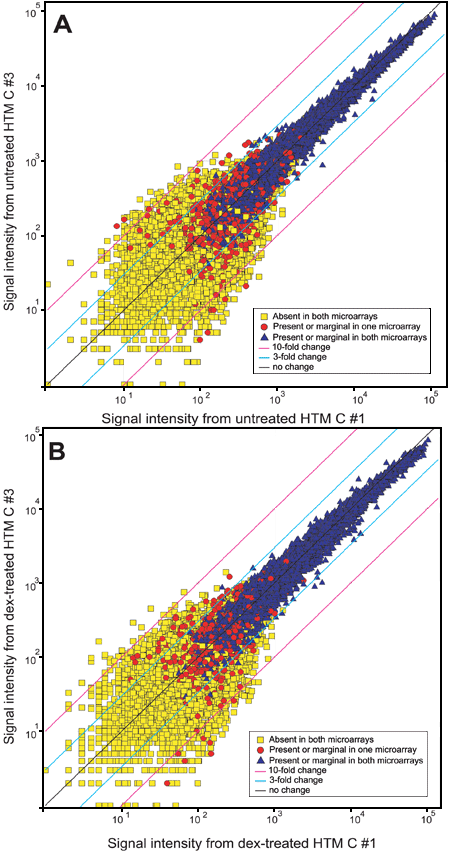
Figure 2. Scatterplots of signal intensities comparing human trabecular meshwork cell cultures with the same treatment status
A: GeneChip data from two different untreated HTM C cultures. B: GeneChip data from two different dexamethasone-treated HTM C cultures. Axes indicate the logarithmic signal intensity corresponding to each probe. Color coding and symbols shown in the key indicate present-absent status based on MAS5.1 software analysis (see Methods). Yellow squares represent probes called absent in both data sets, blue triangles were called present or marginal in both data sets, and red circles were called present or marginal in one data set and absent in the other. Black, light blue, and pink diagonal lines represent change boundaries of no change, three fold, and ten fold change, respectively.
