![]() Figure 4 of
Self, Mol Vis 2006;
12:1211-1216.
Figure 4 of
Self, Mol Vis 2006;
12:1211-1216.
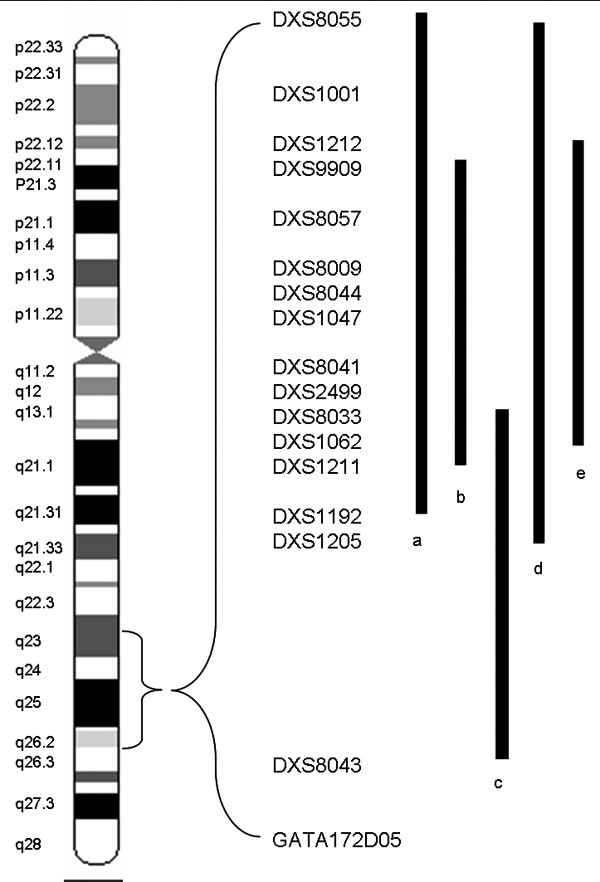
Figure 4.
Diagram of the X chromosome showing the q24-q26 region for X-linked CIN. In the image, a, b, and c represent the critical regions for X-linked dominant CIN reported by: a; [2], b; [10], and c; [9]. Also, d and e represent the critical regions for X-linked recessive CIN reported by: d; [4] and e; this study.
