![]() Figure 1 of
Naskar, Mol Vis 2006;
12:1199-1210.
Figure 1 of
Naskar, Mol Vis 2006;
12:1199-1210.
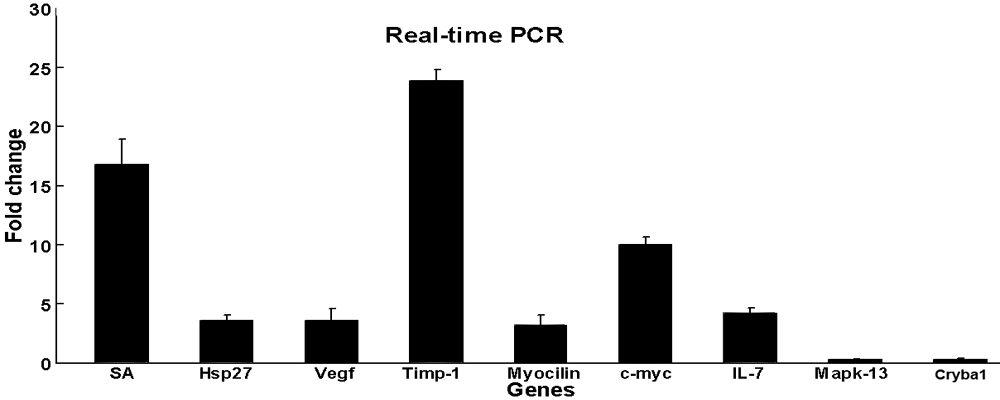
Figure 1. Confirmation of gene expression by quantitative real-time PCR
SA, Hsp-27, Vegf, Timp-1, Myocilin, c-myc, IL-7 were upregulated whereas Mapk-13 and Cryba1 were downregulated due to elevated IOP on the microarrays and their expression was confirmed by qRT-PCR. Change in gene expression is expressed as fold change in relation to controls. Regulation of all nine genes was statistically significant at p<0.0001.
