![]() Figure 11 of
Kompella, Mol Vis 2006;
12:1185-1198.
Figure 11 of
Kompella, Mol Vis 2006;
12:1185-1198.
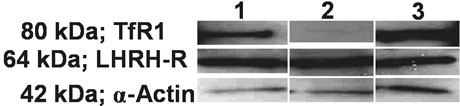
Figure 11.
Differential expression of LHRH and transferrin receptors on various regions of bovine ocular tissue; western blot analysis. The panel shows LHRH-R, TfR-1, TfR-2 and α-actin bands as indicated. Lane 1 in the blot is pituitary, lane 2 represents corneal epithelium, and lane 3 is conjunctiva.