![]() Figure 7 of
Ryan, Mol Vis 2006;
12:1175-1184.
Figure 7 of
Ryan, Mol Vis 2006;
12:1175-1184.
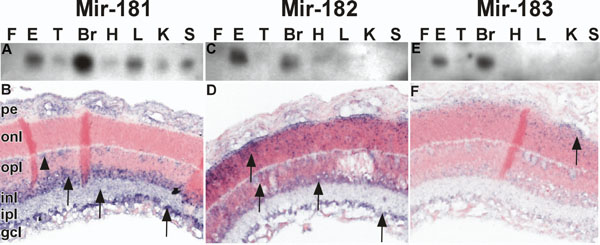
Figure 7.
MicroRNAs reveal distinct distribution patterns within the adult mouse retina. A,C,E: Total RNA (10 μg) from mouse footpad epithelium (F), whole eye globe (E), tongue (T), brain (Br), heart (H), liver (L), kidney (K), and spleen (Sp) were analyzed by northern hybridization with 32P-labeled oligonucleotides to mir-181 (A) -182 (C), and -183 (E). Mir-181 (A) was detected in most tissues with the most abundant signals in the brain, eye, and liver. In contrast mir-182 (C) and -183 (E) we restricted to the brain and eye. B,D,F: Mouse retinal tissues were processed for in situ hybridization with digoxygenin-labeled antisense probes for mir-181 (B) -182 (D), and -183 (F). Signal for mir-181 (B) is detected primarily in the ganglion cell (gc), inner plexiform (ip), and inner nuclear (in) layers (arrows). Patchy expression is noted in the outer nuclear (on) layer. Mir-182 (D) expression is seen in all retinal layers except the pigmented epithelial (pe) region. Mir-183 (F) has the most restricted expression pattern, localized primarily in the outer nuclear layer with a concentration at the outer limiting membrane (arrows).