![]() Figure 2 of
Jin, Mol Vis 2006;
12:1167-1174.
Figure 2 of
Jin, Mol Vis 2006;
12:1167-1174.
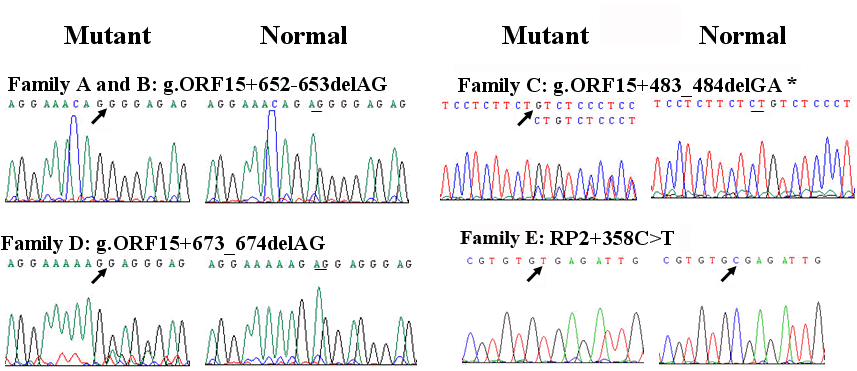
Figure 2. Sequencing data of the mutations
The mutant alleles identified in the present study were compared with the normal alleles. The asterisk indicates the reverse DNA sequence chromatograms. The arrows indicate the mutation points.
