![]() Figure 2 of
Yan, Mol Vis 2006;
12:1153-1159.
Figure 2 of
Yan, Mol Vis 2006;
12:1153-1159.
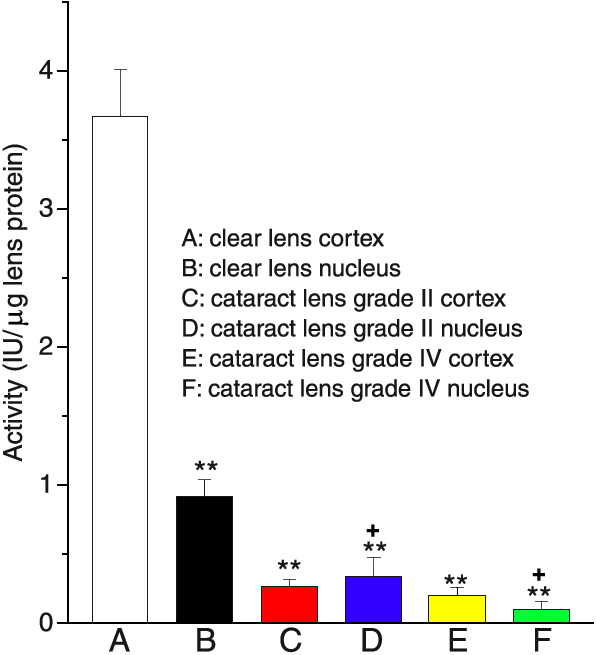
Figure 2.
Distribution of GAPDH activity in human aged clear and cataract lenses. Results are expressed as the mean±SD (n=3). All these results were statistically significantly different from the cortex (A) and the nucleus (B) of clear lenses and the cataract lenses (C-F). The double asterisk indicates a p<0.001 of B, C, D, E, and F versus A; the plus sign indicates a p<0.05 of B versus D and B versus F.
