![]() Figure 2 of
Sakamoto, Mol Vis 2006;
12:117-124.
Figure 2 of
Sakamoto, Mol Vis 2006;
12:117-124.
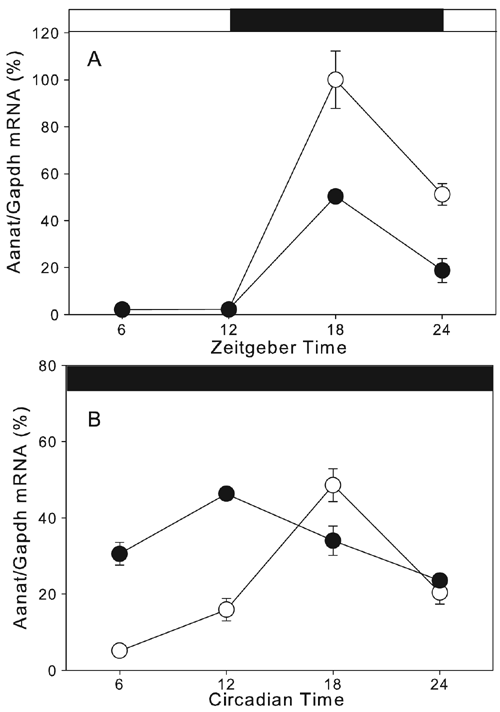
Figure 2. Effects of kainic acid treatment on the daily and circadian rhythm of Aanat mRNA in rat retina
Aanat mRNA levels were rhythmic (Kruskall-Wallis test, p<0.01 in all cases) in saline-injected eyes (white circles) and in KA-injected eyes (black circles) in 12 h:12 h light-dark cycles, LD (A) and in dark-dark cycles, DD (B). The white bar at the top of the graph represents the period of light, while the black bars represent period of darkness. Aanat mRNA levels were measured using real-time quantitative RT-PCR. Mean values are plotted (4 rats/time in LD; 8 rats/time in DD); error bars represent the SEM. All values were normalized with respect to the values obtained in LD at Zeitbeger time 18 in saline injected eyes (100%).
