![]() Table 3 of
Perra, Mol Vis 2006;
12:1136-1142.
Table 3 of
Perra, Mol Vis 2006;
12:1136-1142.
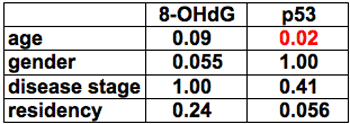
Table 3.
Shown are the p-values in the relationship between the immunohistochemical results and clinical variables, as analyzed by Fisher's exact test or by Student's t-test. The statistically significant correlation is marked in red.
